library("ggplot2")
segmentos = data.frame(
x= c(1.5, 1.5, 1.5),
xend = c(1.7, 1.7, 1.7),
y = c(90, 93, 96),
yend = c(90, 93, 96))
segmentos2 = data.frame(
y = c(50,50,50),
yend = c(50,50,50),
x= c(4, 4.5, 5),
xend = c(4.5, 5, 5.5))
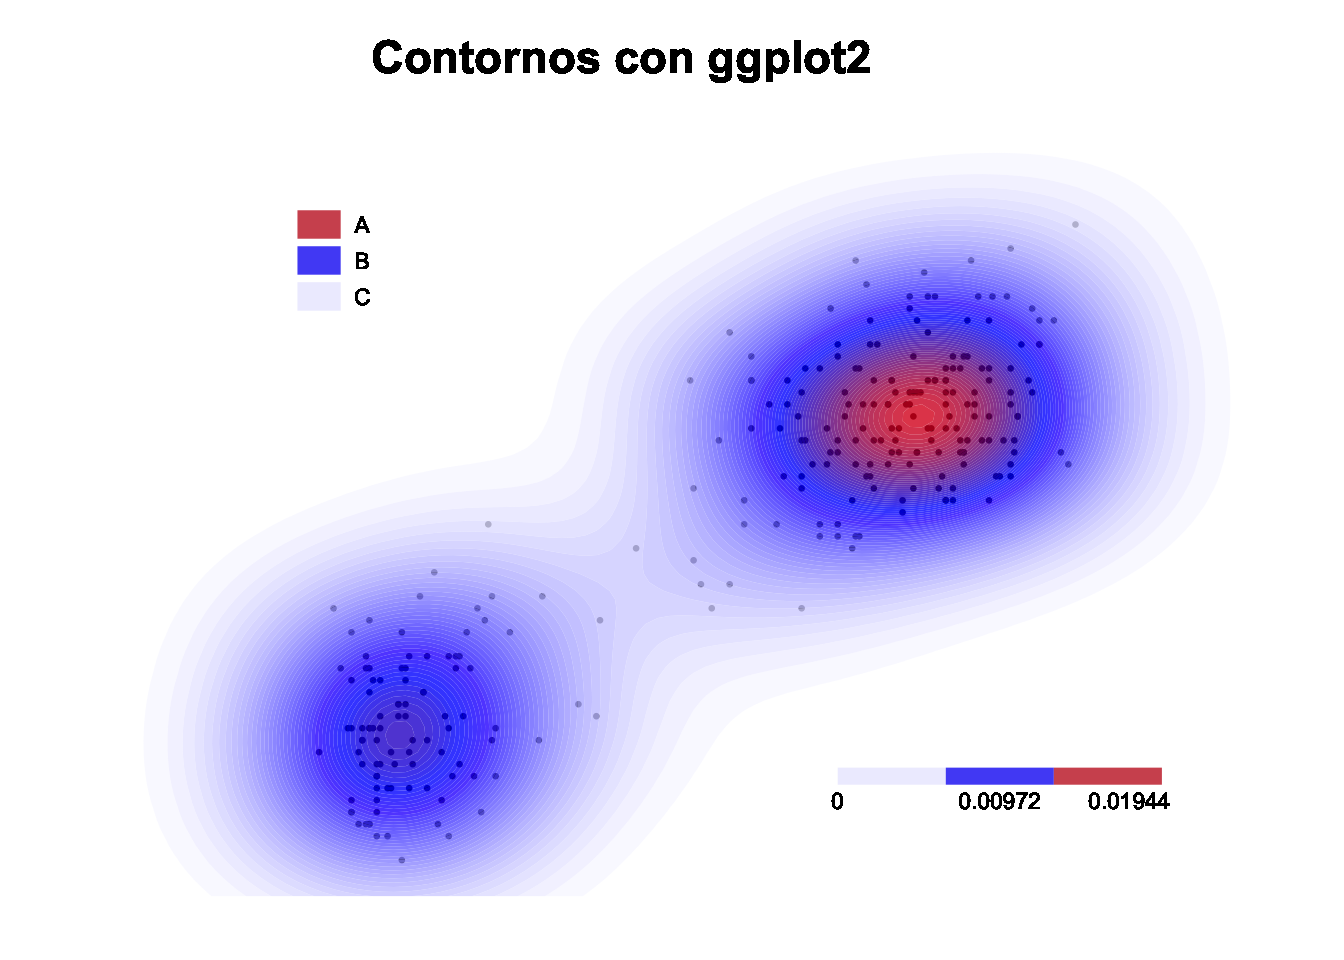
lista <- colorRampPalette(c("white", "blue", "red"))(75)
ggplot(faithful, aes(x = eruptions, y = waiting)) +
geom_point(size=.5) +
xlim(0.5, 6) +
ylim(40, 110) +
geom_density_2d_filled(alpha = 0.8, bins=75) +
scale_fill_manual(values = lista) +
geom_segment(data=segmentos, mapping=aes(x=x, xend=xend, y=y, yend=yend), color= c("#EEEEFE", "#5356f6", "#D2565E"), linewidth=5) +
geom_segment(data=segmentos2, mapping=aes(x=x, xend=xend, y=y, yend=yend), color= c("#EEEEFE", "#5356f6", "#D2565E"), linewidth=3) +
geom_text(mapping=aes(label="Contornos con ggplot2", y=(110), x=3), size=6, color="black", fontface="bold") +
geom_text(mapping=aes(label="C", y=(90), x=1.8), size=3, color="black") +
geom_text(mapping=aes(label="B", y=(93), x=1.8), size=3, color="black") +
geom_text(mapping=aes(label="A", y=(96), x=1.8), size=3, color="black") +
geom_text(mapping=aes(label="0", y=(48), x=4), size=3, color="black") +
geom_text(mapping=aes(label="0.00972", y=(48), x=4.75), size=3, color="black") +
geom_text(mapping=aes(label="0.01944", y=(48), x=5.35), size=3, color="black") +
theme(
legend.position = "none",
plot.background=element_rect(fill="white", color="white"),
panel.background = element_rect(fill="white", color="white"),
axis.ticks=element_blank(),
axis.title.x=element_blank(),
axis.text.x = element_blank(),
axis.title.y=element_blank(),
axis.text.y = element_blank()
)