# PLOT
plot <- ggplot(data, aes(x=reorder(animal,-n), count, image = image)) +
geom_isotype_col() + xlab("") + ylab("")+
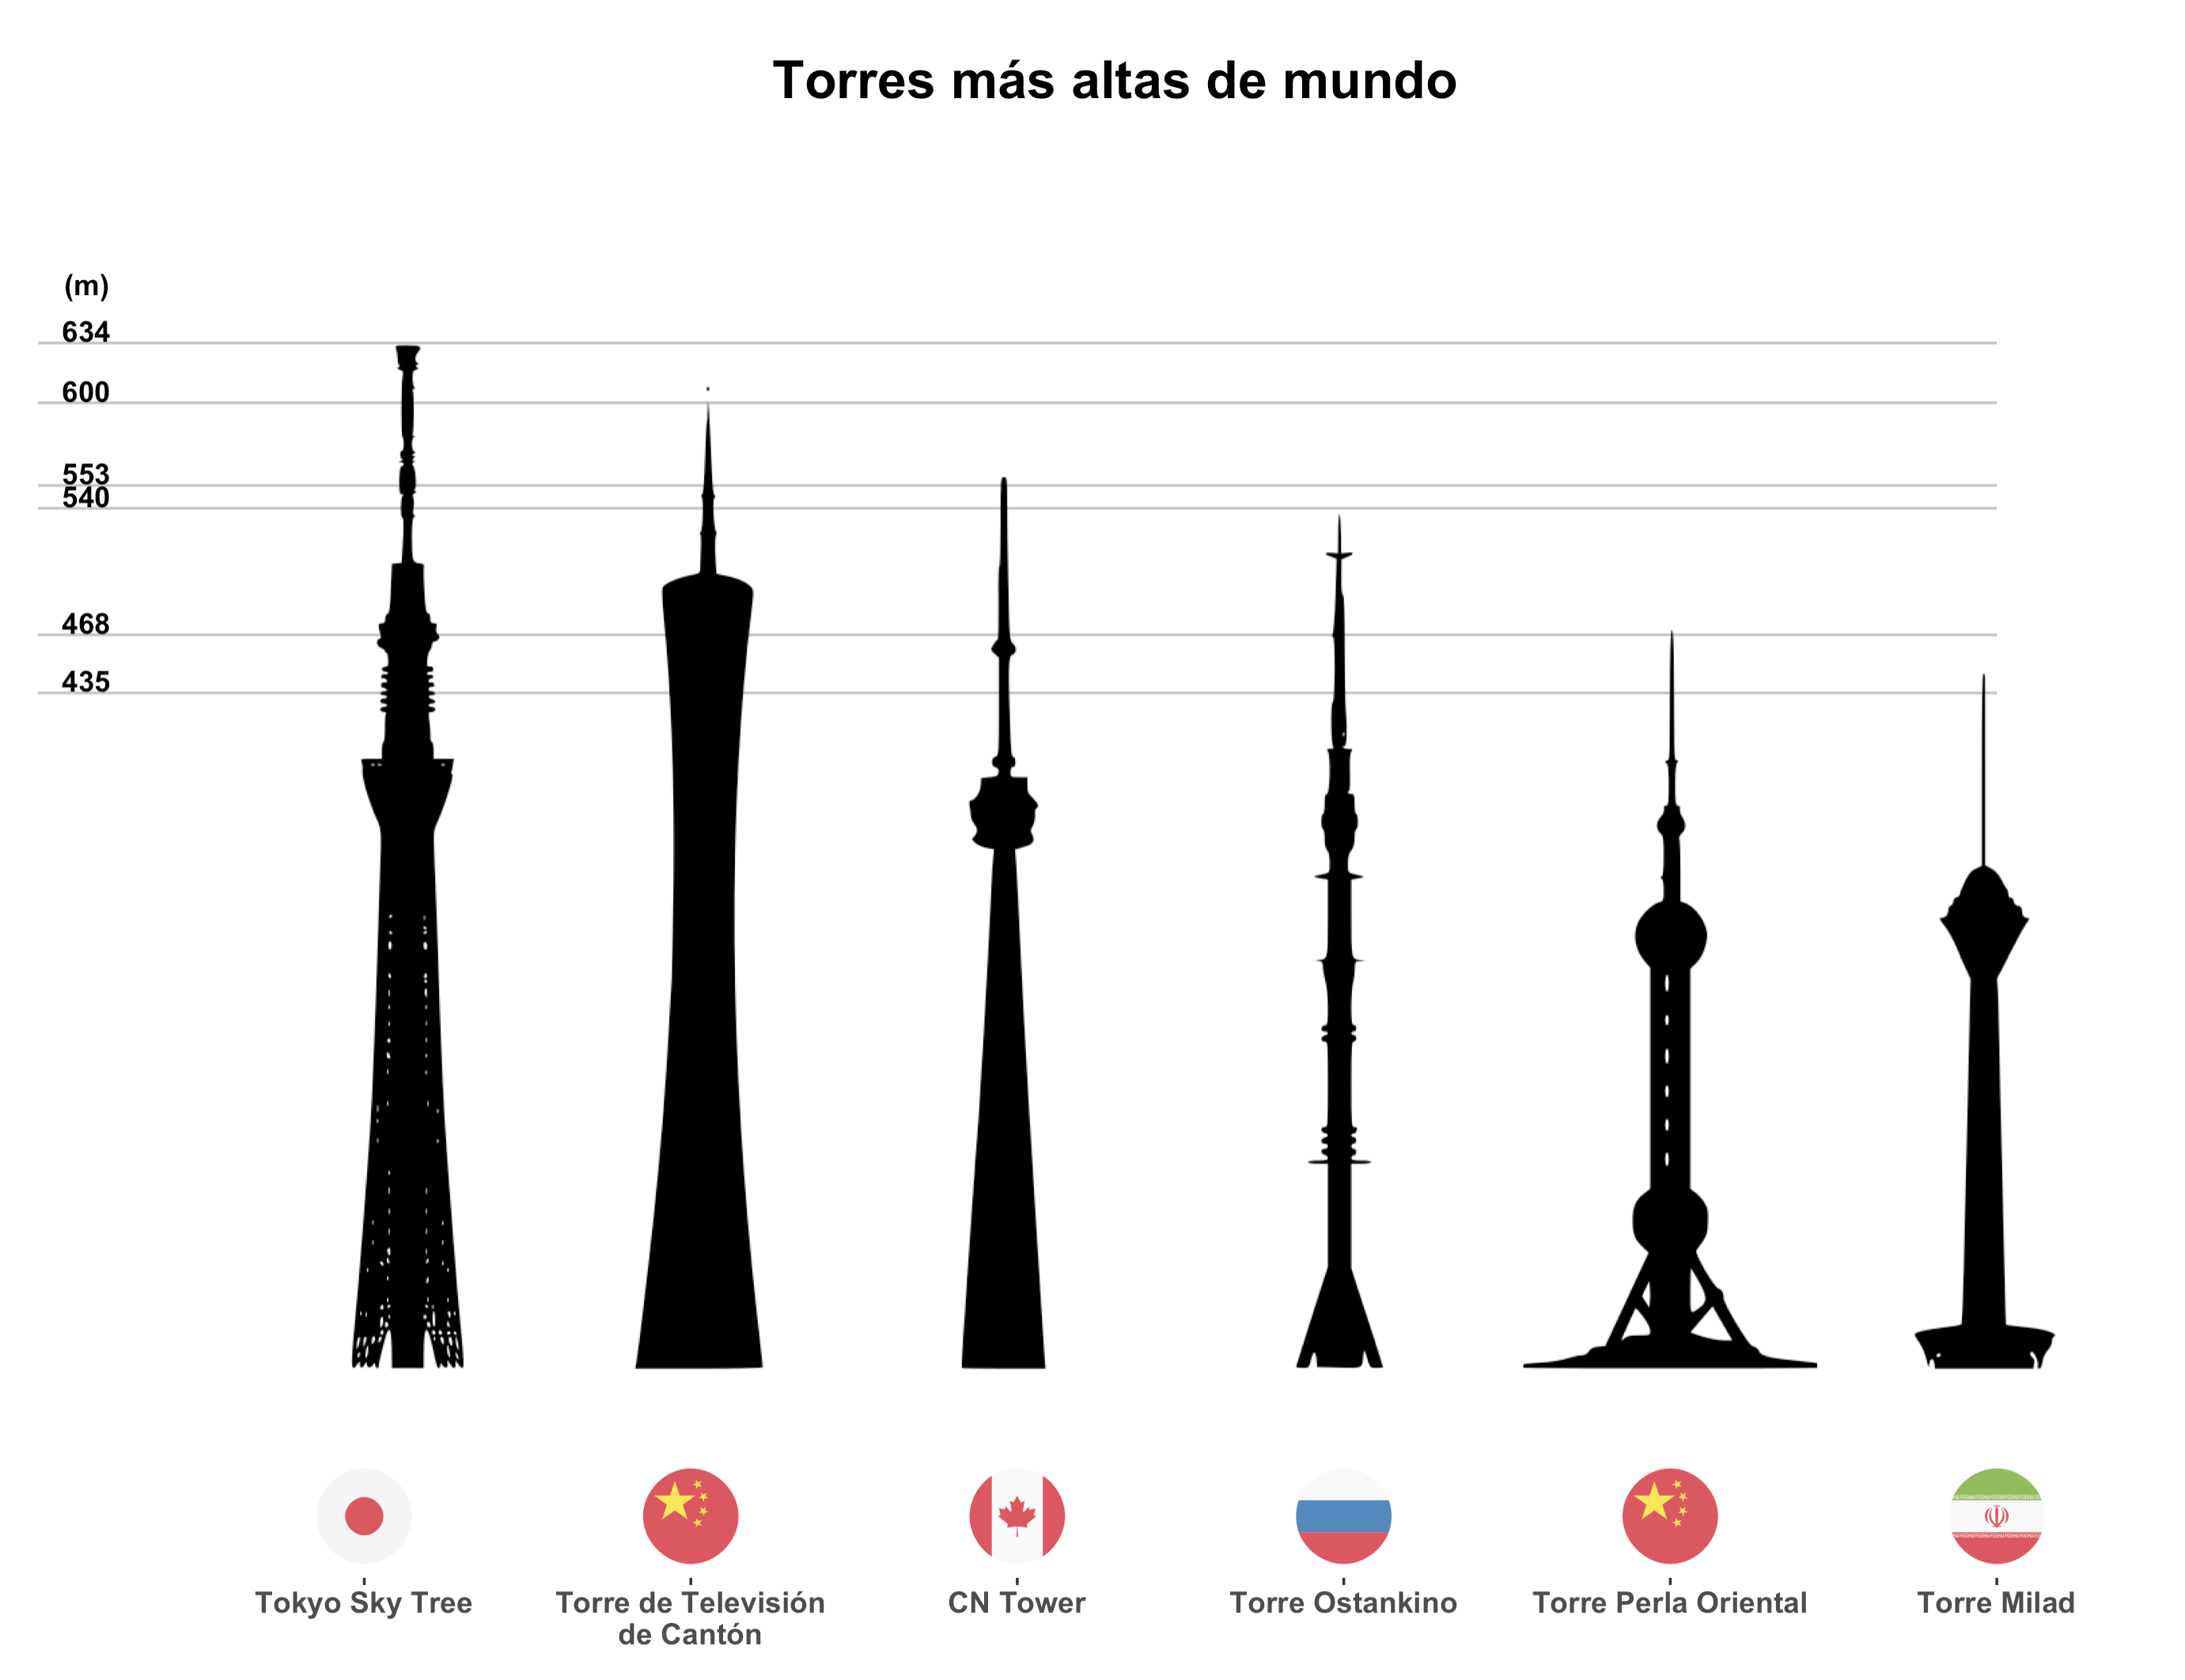
labs(title="\nTorres más altas de mundo", subtitle = "\n",
caption = "\n", fill= "Districts") +
geom_flag(aes(x=reorder(animal,-n), y= -.05,
country=code), size=15 ) +
geom_segment(aes(x = 0, y = (.95), xend = "Torre Milad", yend = (.95)), alpha=.05) +
geom_segment(aes(x = 0, y = ((600*0.95)/634), xend = "Torre Milad", yend = ((600*0.95)/634)), alpha=.05) +
geom_segment(aes(x = 0, y = ((553*0.95)/634), xend = "Torre Milad", yend = ((553*0.95)/634)), alpha=.05) +
geom_segment(aes(x = 0, y = ((540*0.95)/634), xend = "Torre Milad", yend = ((540*0.95)/634)), alpha=.05) +
geom_segment(aes(x = 0, y = ((468*0.95)/634), xend = "Torre Milad", yend = ((468*0.95)/634)), alpha=.05) +
geom_segment(aes(x = 0, y = ((435*0.95)/634), xend = "Torre Milad", yend = ((435*0.95)/634)), alpha=.05) +
annotate(x = .15, y = (1), "text", label= "(m)", fontface =2) +
annotate(x = .15, y = (.96), "text", label= "634", fontface =2) +
annotate(x = .15, y = ((600*0.95)/634) + 0.01, "text", label= "600", fontface =2) +
annotate(x = .15, y = ((553*0.95)/634) + 0.01, "text", label= "553", fontface =2) +
annotate(x = .15, y = ((540*0.95)/634) + 0.01, "text", label= "540", fontface =2) +
annotate(x = .15, y = ((468*0.95)/634) + 0.01, "text", label= "468", fontface =2) +
annotate(x = .15, y = ((435*0.95)/634) + 0.01, "text", label= "435", fontface =2) +
theme(text = element_text(size = 14, face = "bold"),
axis.text.y = element_blank(),
axis.ticks.y = element_blank(),
panel.spacing = unit(0, "pt"),
panel.border = element_blank(),
panel.grid.major.x = element_blank(),
strip.background = element_blank(),
strip.text = element_text(colour = "black"),
plot.title = element_text(size = 20, face="bold", hjust = 0.5),
plot.subtitle = element_text(size = 16, face="bold", hjust = 0.5),
plot.caption = element_text(size = 10, face="bold", hjust = 1),
panel.background = element_rect(fill = "white", colour = "white")) +
guides(colour = guide_legend(title = "Location type", face="bold",
override.aes = list(size=6,linetype=0)))