Working with the libraries: “sf”, “stringr”, “dplyr”, “ggplot2” and “ggthemes”. 🇺🇦
Code
# lIB
{
library('sf')
library("ggplot2")
library("dplyr")
library("stringr")
}
ru <- read_sf('ruso/Ruso_Parlantes_Ucrania.shp')
ru <- ru %>%
st_as_sf()
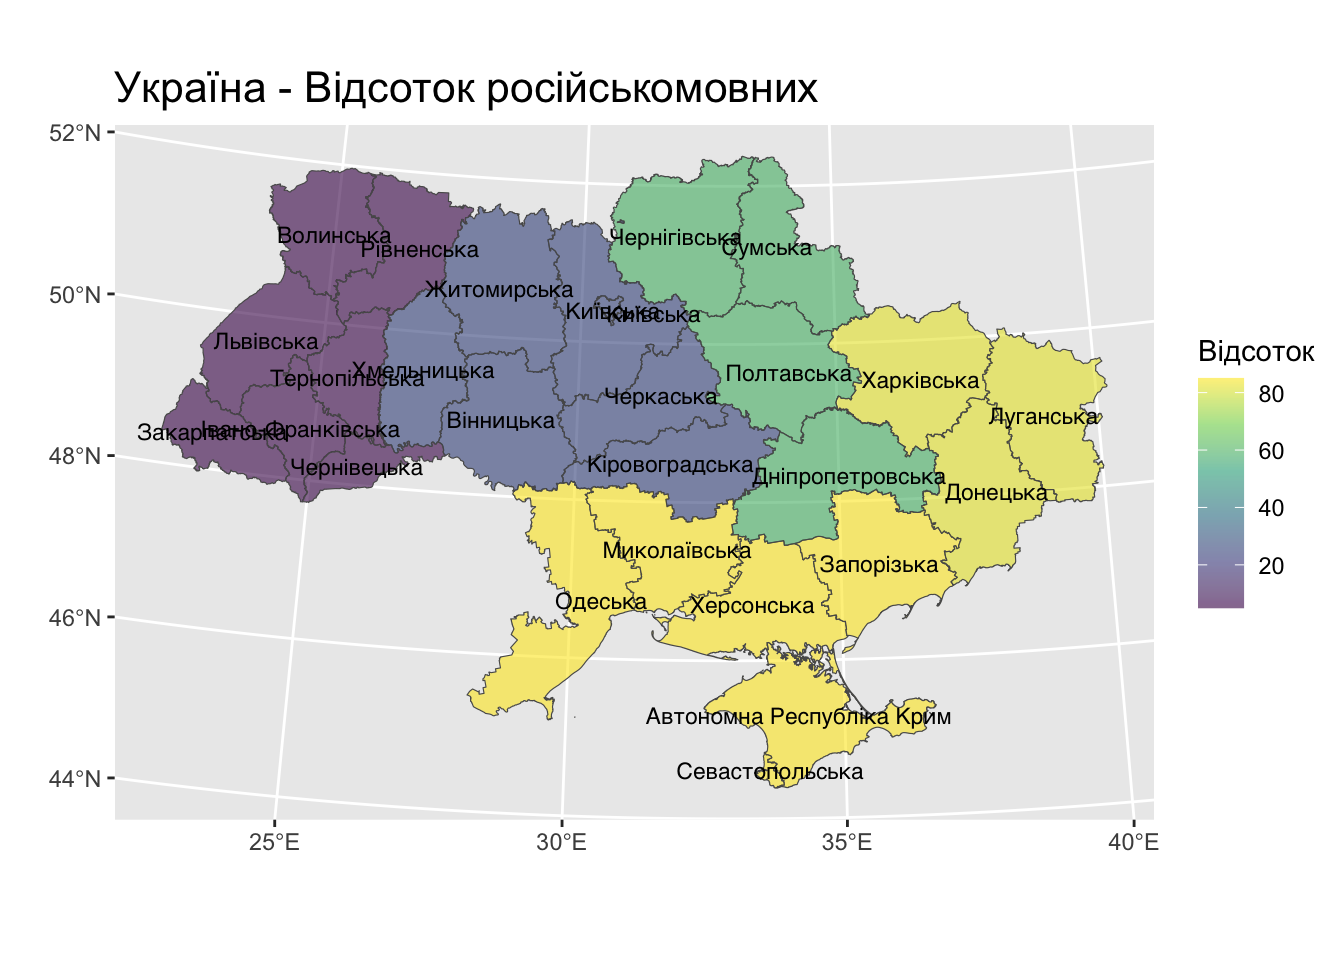
A <- ggplot(data = ru) +
ggtitle("Україна - Відсоток російськомовних") +
xlab("") +
ylab("") +
geom_sf(aes(fill=PorcRus), show.legend = T, size = 0.05) +
scale_fill_viridis_c(alpha = .6) +
geom_sf_text(aes(label =Ucraniano),size=3,family="sans")+
theme(plot.title = element_text(size = 16),
plot.subtitle = element_text(size = 20)) +
labs(fill= "Відсоток")
A
Code
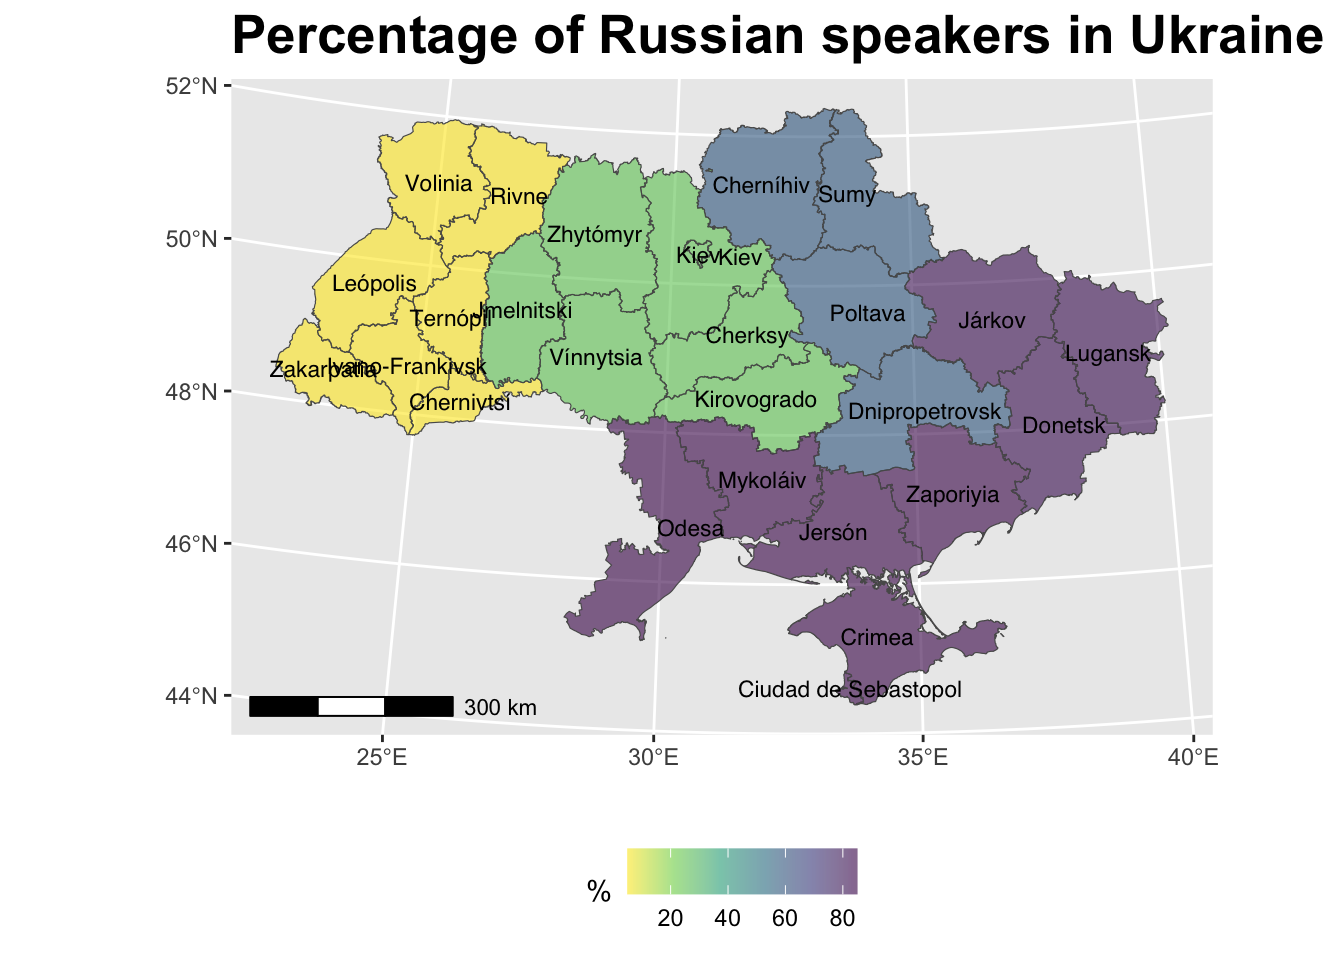
library("ggspatial")

ru$Español <- gsub("Ciudad de Kiev","Kiev ",ru$Español)
ru$Español <- gsub("República Autónoma de Crimea","Crimea",ru$Español)

es <- ggplot(data = ru) +
  ggtitle("Percentage of Russian speakers in Ukraine") +
  xlab("") +
  ylab("") +
  geom_sf(aes(fill=PorcRus), show.legend = T, size = 0.05) +
  scale_fill_viridis_c(alpha = .6, direction = -1) +
  geom_sf_text(aes(label =Español),size=3,family="sans")+
  theme(plot.title = element_text(size = 20, face = "bold"),
        plot.subtitle = element_text(size = 20),
        legend.position="bottom") +
  labs(fill= "%") +
  annotation_scale()

es
Shapefile layers 2019 Data: gov.uk