This chart highlights the five countries with the highest coffee production in the world, taking into account various quality measures: aroma, flavor, aftertaste, acidity, body, balance, uniformity, cup cleanliness, sweetness, moisture, and defects.
Important
ES
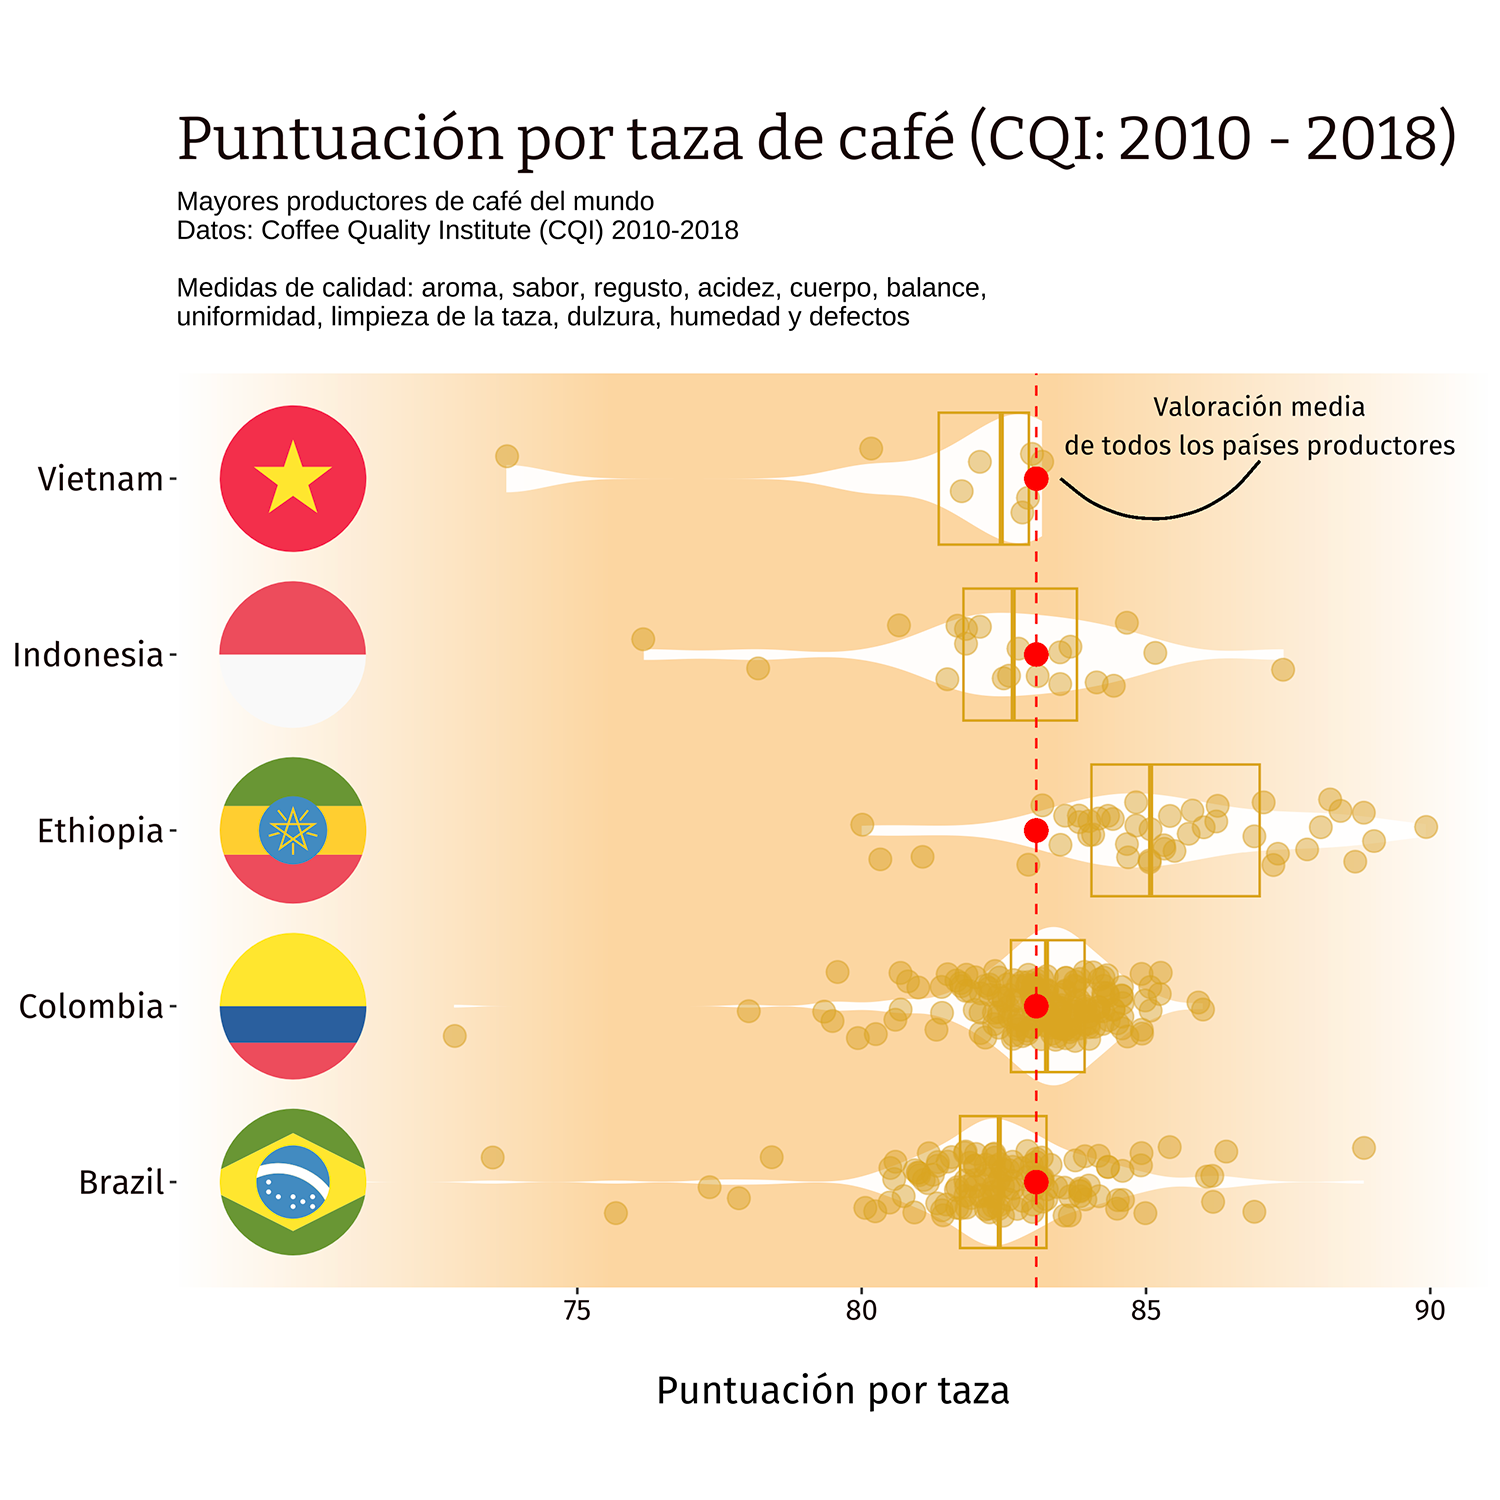
En este gráfico destacan los cinco países con mayor producción de café en el mundo, tomando en cuenta varias medidas de calidad: aroma, sabor, regusto, acidez, cuerpo, balance, uniformidad, limpieza de la taza, dulzura, humedad y defectos.
Important
IT
IT Questo grafico evidenzia i cinque paesi con la più alta produzione di caffè al mondo, tenendo conto di vari parametri di qualità: aroma, sapore, retrogusto, acidità, corposità, equilibrio, uniformità, pulizia della tazza, dolcezza, umidità e difetti.
Code
# LIBRARIESlibrary(tidyverse)library(ggpubr)library(reshape2)library(ggcorrplot)library(ggcharts)library(tmaptools)library(prismatic)library(patchwork)library(gridExtra)library(ggflags)library(showtext)library(camcorder)library(ggtext)# FONTSfont_add_google("Luckiest Guy","ramp")font_add_google("Bebas Neue","beb")font_add_google("Fira Sans","fira")font_add_google("Raleway","ral")font_add_google("Bitter","bit")showtext_auto()# DATAcoffee_ratings <- readr::read_csv('https://raw.githubusercontent.com/rfordatascience/tidytuesday/master/data/2020/2020-07-07/coffee_ratings.csv')coffee_ratings =data.frame(coffee_ratings, stringsAsFactors =FALSE)coffee_ratings <- coffee_ratings %>%filter(country_of_origin %in%c("Brazil", "Vietnam", "Colombia", "Indonesia", "Ethiopia")) coffee_ratings <- coffee_ratings %>%mutate(iso3 = countrycode::countrycode(country_of_origin,origin ="country.name.en",destination ="iso3c"))data2 <-tibble(count =c(1,1,1,1,1),n =c(1,2,3,4,5),country =c("Brazil", "Vietnam", "Colombia", "Indonesia", "Ethiopia"),code =c("br","vn","co","id","et"))data1 <- coffee_ratings %>%mutate(iso3 = countrycode::countrycode(country_of_origin,origin ="country.name.en",destination ="iso3c"))# PLOTp1 <-ggplot(data=coffee_ratings) +#annotation_custom(grob = g, xmin = -Inf, xmax = Inf, ymin = -Inf, ymax = Inf) + xlim(69,90) +geom_violin(aes(y = country_of_origin, x = total_cup_points), color=NA, alpha=.95 ) +geom_jitter(aes(y = country_of_origin, x = total_cup_points),height = .2, size =4,alpha = .5,color ="#daa520") +geom_boxplot(aes(y = country_of_origin, x = total_cup_points),alpha =0,outlier.shape =NA,coef =0,color ="#daa520",fill ="red") +geom_vline(xintercept =mean(coffee_ratings$total_cup_points),linetype =2,size =0.5, col="red") +geom_curve(x =83.5, y =5, xend =87, yend =5.1)+annotate("text", label ="Valoración media\nde todos los países productores", x =87, y =5.3, family ="fira") +geom_segment(aes(x =mean(total_cup_points), y = country_of_origin, yend= country_of_origin, xend=83, col="red" )) +geom_point(aes(y = country_of_origin, x =mean(total_cup_points)),size =4, col ="red") +labs(title ="\nPuntuación por taza de café (CQI: 2010 - 2018)",subtitle ="Mayores productores de café del mundo\nDatos: Coffee Quality Institute (CQI) 2010-2018\n\nMedidas de calidad: aroma, sabor, regusto, acidez, cuerpo, balance,\nuniformidad, limpieza de la taza, dulzura, humedad y defectos\n",caption ="") +xlab("\nPuntuación por taza") +ylab(" ") +geom_flag(data=data2, aes(y=country, x=70,country=code), size=25 ) +theme(legend.position ="none",panel.grid.major =element_line(size =0.1, linetype ='solid',colour ="white"), panel.grid.minor =element_line(size =0.1, linetype ='solid',colour ="white"),axis.title.x=element_text(size=16, family ="fira"),plot.title=element_text(size=25, family ="bit", color ="#190706"),axis.text.y =element_text(color ="#190706", size=14, family ="fira"),axis.text.x =element_text(color ="#190706", size=12, family ="fira"), )#p1