# Load packages -----------------------------------------------------------
library(tidyverse)
library(showtext)
library(camcorder)
library(ggtext)
library(glue)
library(tsibble)
# Load data ---------------------------------------------------------------
tuesdata <- tidytuesdayR::tt_load("2025-03-04")
longbeach <- tuesdata$longbeach
# Load fonts --------------------------------------------------------------
font_add_google("Montserrat")
showtext_auto()
showtext_opts(dpi = 300)
# Define colours and fonts-------------------------------------------------
bg_col <- "#E3DBDB"
text_col <- "#2E2424"
highlight_col <- "#439A86"
body_font <- "Montserrat"
# Data wrangling ----------------------------------------------------------
plot_data <- longbeach |>
filter(intake_type == "owner surrender", animal_type == "dog") |>
count(intake_date) |>
tsibble::as_tsibble(index = intake_date) |>
tsibble::fill_gaps(
n = 0,
.start = ymd("20170101"),
.end = ymd("20241231")
) |>
as_tibble()
year_data <- plot_data |>
mutate(year = year(intake_date)) |>
group_by(year) |>
summarise(n = sum(n)) |>
mutate(
start = ymd(paste0(year, "-01-01")),
end = ymd(paste0(year + 1, "-01-01")),
mid = ymd(paste0(year, "-07-02"))
)
# Annotation function -----------------------------------------------------
textbox <- function(x, y, label, ...) {
geom_textbox(
data = data.frame(x = x, y = y, label = label),
mapping = aes(
x = x, y = y,
label = label
),
halign = 0.5,
hjust = 0.5,
size = 3,
colour = text_col,
fill = alpha(bg_col, 0.4),
box.colour = "transparent",
lineheight = 0.6,
...
)
}
curved_arrow <- function(x_start, x_end, y_start, y_end, ...) {
annotate(
geom = "curve",
x = x_start,
xend = x_end,
y = y_start,
yend = y_end,
linewidth = 0.3,
color = text_col,
arrow = arrow(
length = unit(1.5, "mm"), type = "closed"
),
...
)
}
# Start recording ---------------------------------------------------------
gg_record(
dir = file.path("2025", "2025-03-04", "recording"),
device = "png",
width = 7,
height = 5.5,
units = "in",
dpi = 300
)
# Define text -------------------------------------------------------------
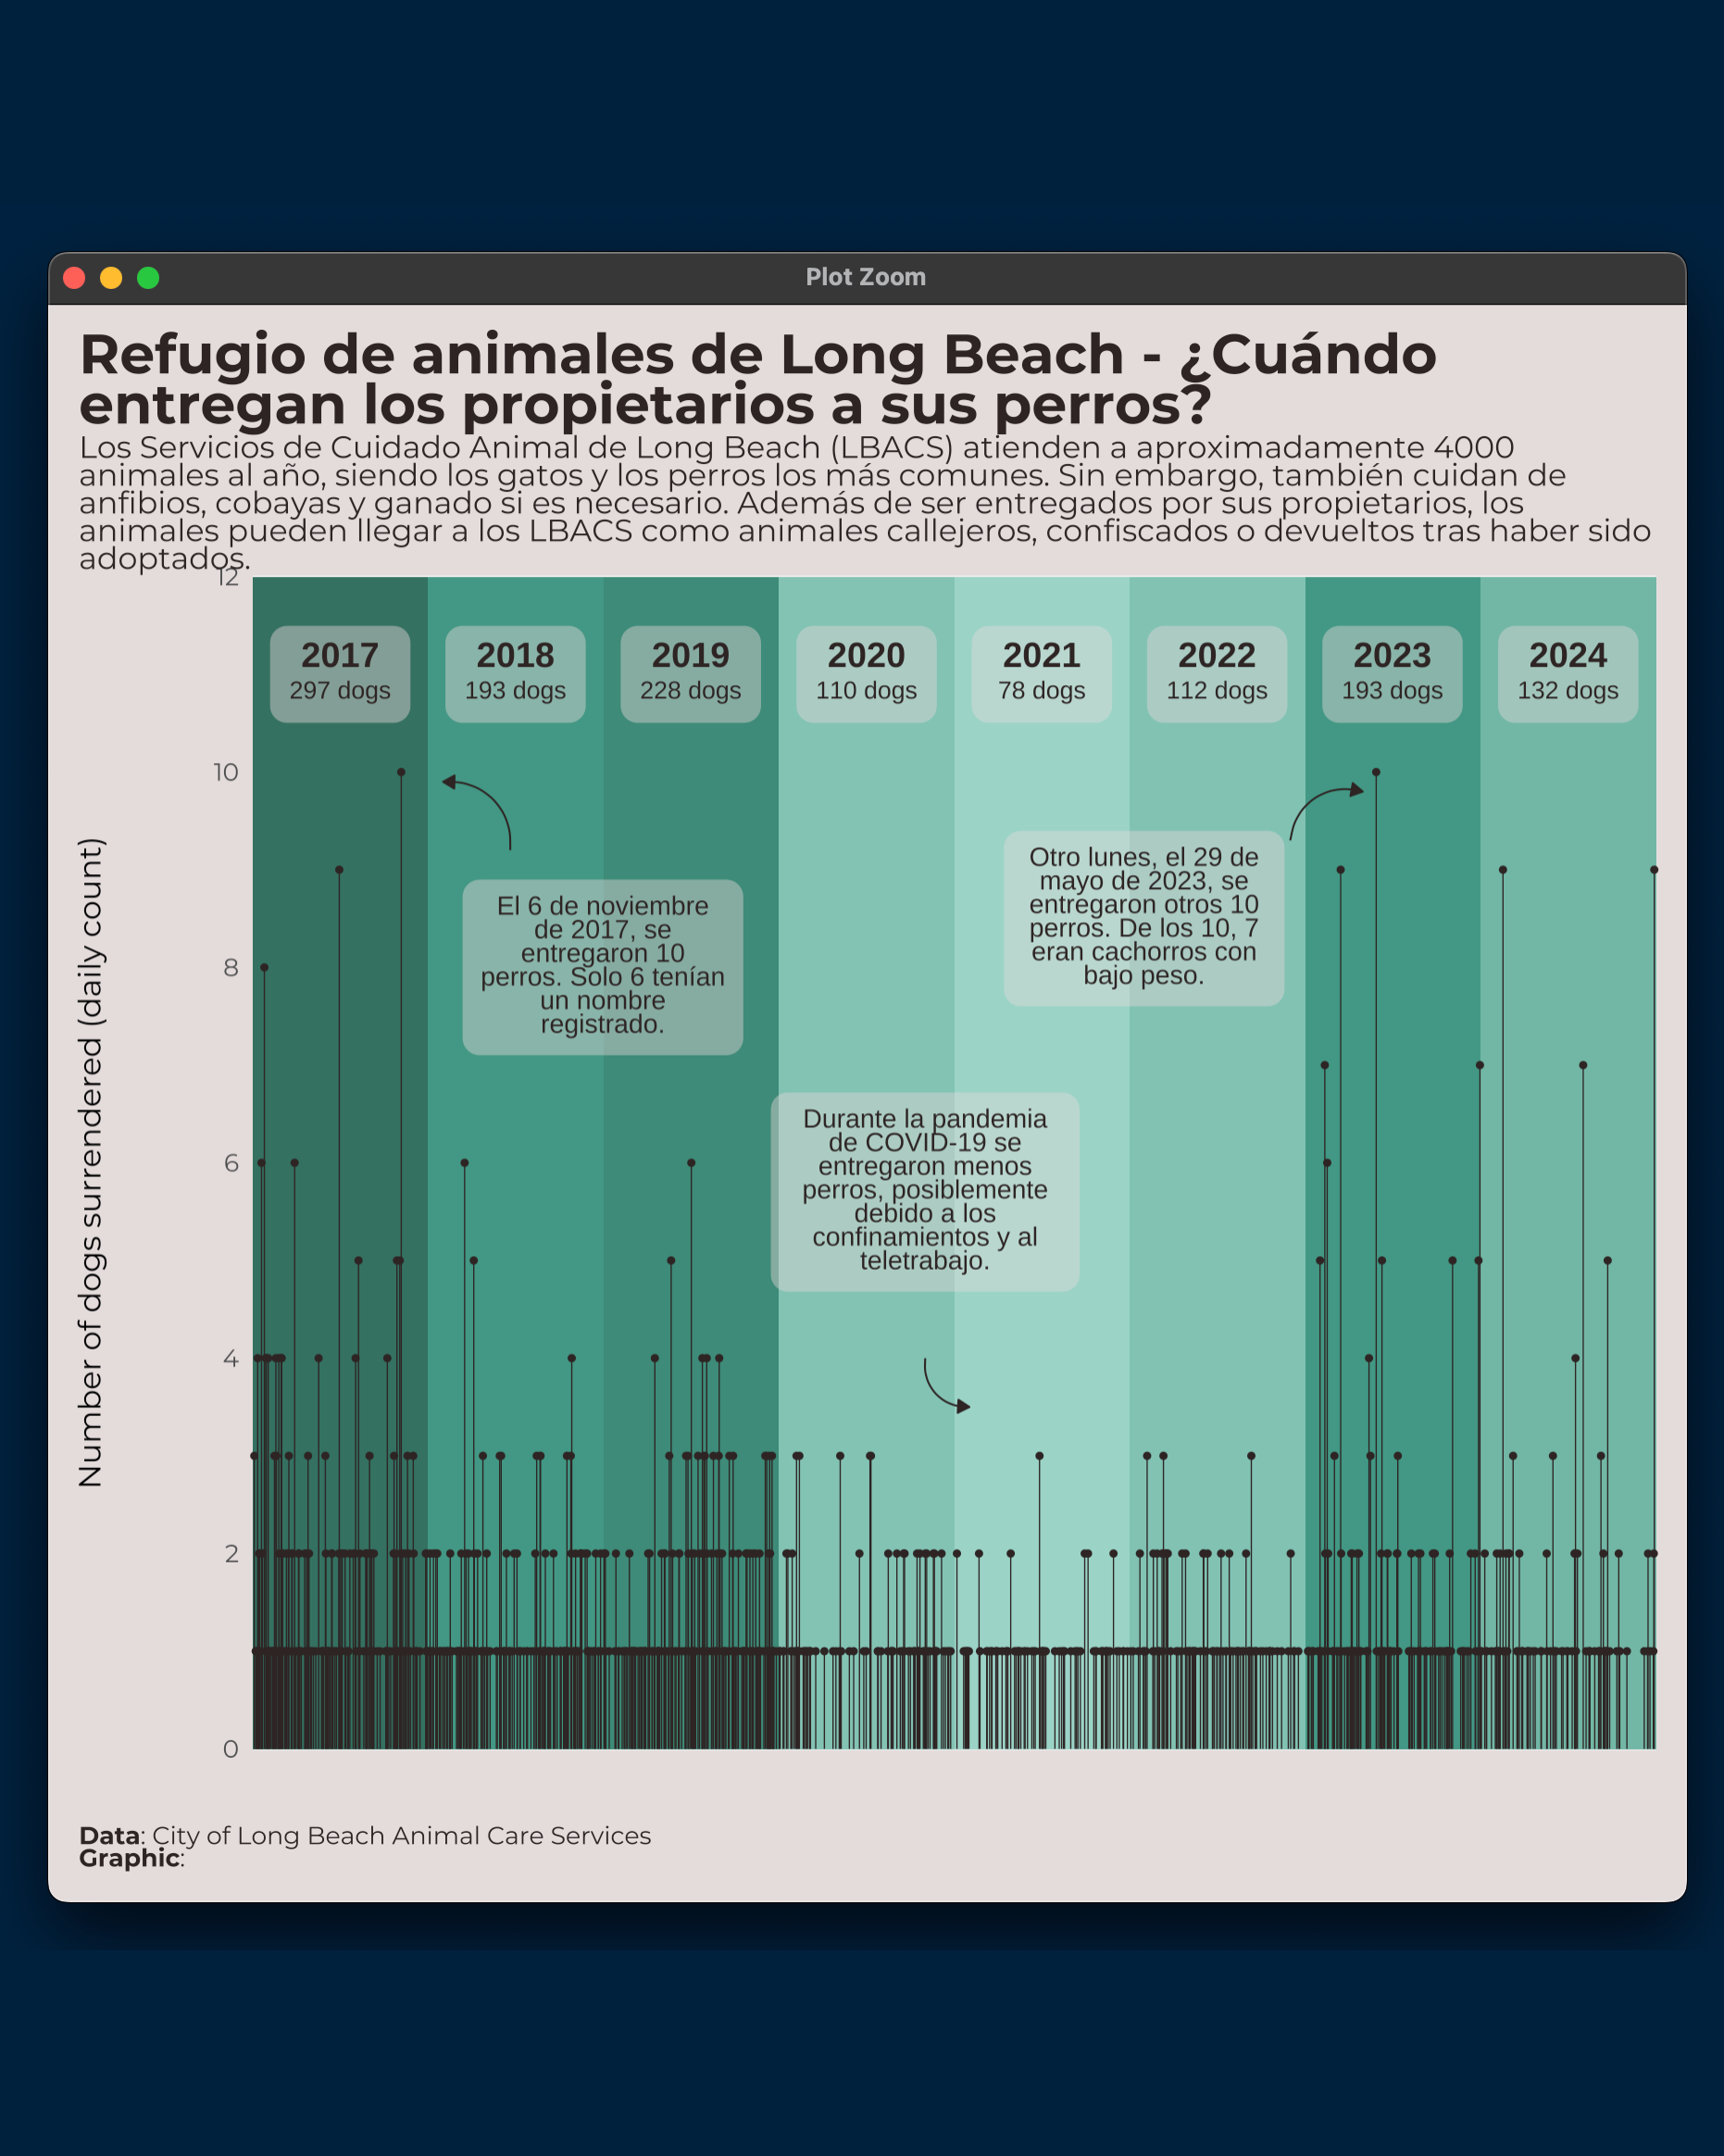
title <- "Refugio de animales de Long Beach - ¿Cuándo entregan los propietarios a sus perros?"
st <- "Los Servicios de Cuidado Animal de Long Beach (LBACS) atienden a aproximadamente 4000 animales al año, siendo los gatos y los perros los más comunes. Sin embargo, también cuidan de anfibios, cobayas y ganado si es necesario. Además de ser entregados por sus propietarios, los animales pueden llegar a los LBACS como animales callejeros, confiscados o devueltos tras haber sido adoptados."
cap <- paste0(
"**Data**: City of Long Beach Animal Care Services<br>**Graphic**:", ""
)
# Plot --------------------------------------------------------------------
p <- ggplot() +
geom_rect(
data = year_data,
mapping = aes(
xmin = start,
xmax = end,
ymin = 0,
ymax = 12,
fill = n
)
) +
geom_segment(
data = plot_data,
mapping = aes(
x = intake_date,
y = 0,
yend = n
),
colour = text_col,
linewidth = 0.2
) +
geom_point(
data = filter(plot_data, n > 0),
mapping = aes(
x = intake_date,
y = n
),
colour = text_col,
size = 0.6
) +
geom_textbox(
data = year_data,
mapping = aes(
x = mid,
y = 11,
label = glue("**{year}**<br><span style='font-size: 8pt;'>{n} dogs</span>")
),
halign = 0.5,
hjust = 0.5,
size = 4,
colour = text_col,
fill = alpha(bg_col, 0.4),
box.colour = "transparent",
width = 0.1,
lineheight = 0.6,
minwidth = 0.1,
maxwidth = 0.1
) +
# annotations
textbox(
x = ymd("20181231"), y = 8,
label = "El 6 de noviembre de 2017, se entregaron 10 perros. Solo 6 tenían un nombre registrado.", width = 0.2
) +
textbox(
x = ymd("20220131"), y = 8.5,
label = "Otro lunes, el 29 de mayo de 2023, se entregaron otros 10 perros. De los 10, 7 eran cachorros con bajo peso.", width = 0.2
) +
textbox(
x = ymd("20201101"), y = 5.7,
label = "Durante la pandemia de COVID-19 se entregaron menos perros, posiblemente debido a los confinamientos y al teletrabajo.", width = 0.22
) +
# arrows
curved_arrow(ymd("20180621"), ymd("20180201"), 9.2, 9.9, curvature = 0.5) +
curved_arrow(ymd("20221201"), ymd("20230501"), 9.3, 9.8, curvature = -0.5) +
curved_arrow(ymd("20201101"), ymd("20210201"), 4, 3.5, curvature = 0.5) +
# styling
scale_y_continuous(
breaks = seq(0, 12, by = 2)
) +
scale_fill_gradientn(
colours = c("#9CD3C6", "#439A86", "#337162")
) +
labs(
x = "",
y = "Number of dogs surrendered (daily count)",
title = title,
subtitle = st,
caption = cap
) +
coord_cartesian(expand = FALSE, clip = "off") +
theme_minimal(base_family = body_font, base_size = 10) +
theme(
legend.position = "none",
plot.margin = margin(5, 10, 5, 10),
plot.title.position = "plot",
plot.caption.position = "plot",
plot.background = element_rect(fill = bg_col, colour = bg_col),
panel.background = element_rect(fill = bg_col, colour = bg_col),
axis.text.x = element_blank(),
plot.title = element_textbox_simple(
colour = text_col,
hjust = 0,
halign = 0,
margin = margin(b = 5, t = 5),
lineheight = 0.5,
family = body_font,
face = "bold",
size = rel(1.8)
),
plot.subtitle = element_textbox_simple(
colour = text_col,
hjust = 0,
halign = 0,
margin = margin(b = 5, t = 0),
lineheight = 0.5,
family = body_font
),
plot.caption = element_textbox_simple(
colour = text_col,
hjust = 0,
halign = 0,
margin = margin(b = 5, t = 5),
lineheight = 0.5,
family = body_font
)
)
pWorld’s tallest towers (Top 6)