Qualification of a university student in their last 7 semesters. 🇨🇭
{
library(ggplot2)
library(dplyr)
library(hrbrthemes)
library(viridis)
library(readxl)
library(patchwork)
}
note <- read_excel("note.xlsx")
not <- note %>%
group_by(Semester, kk) %>%
summarise(mean = mean(Note), sum = sum(Note), n = n())
not <- not %>%
arrange(kk)
not$kk <- as.factor(not$kk)
lb <- c("HS2018", "FS2019", "HS2019",
"FS2020", "HS2020", "FS2021",
"HS2021")
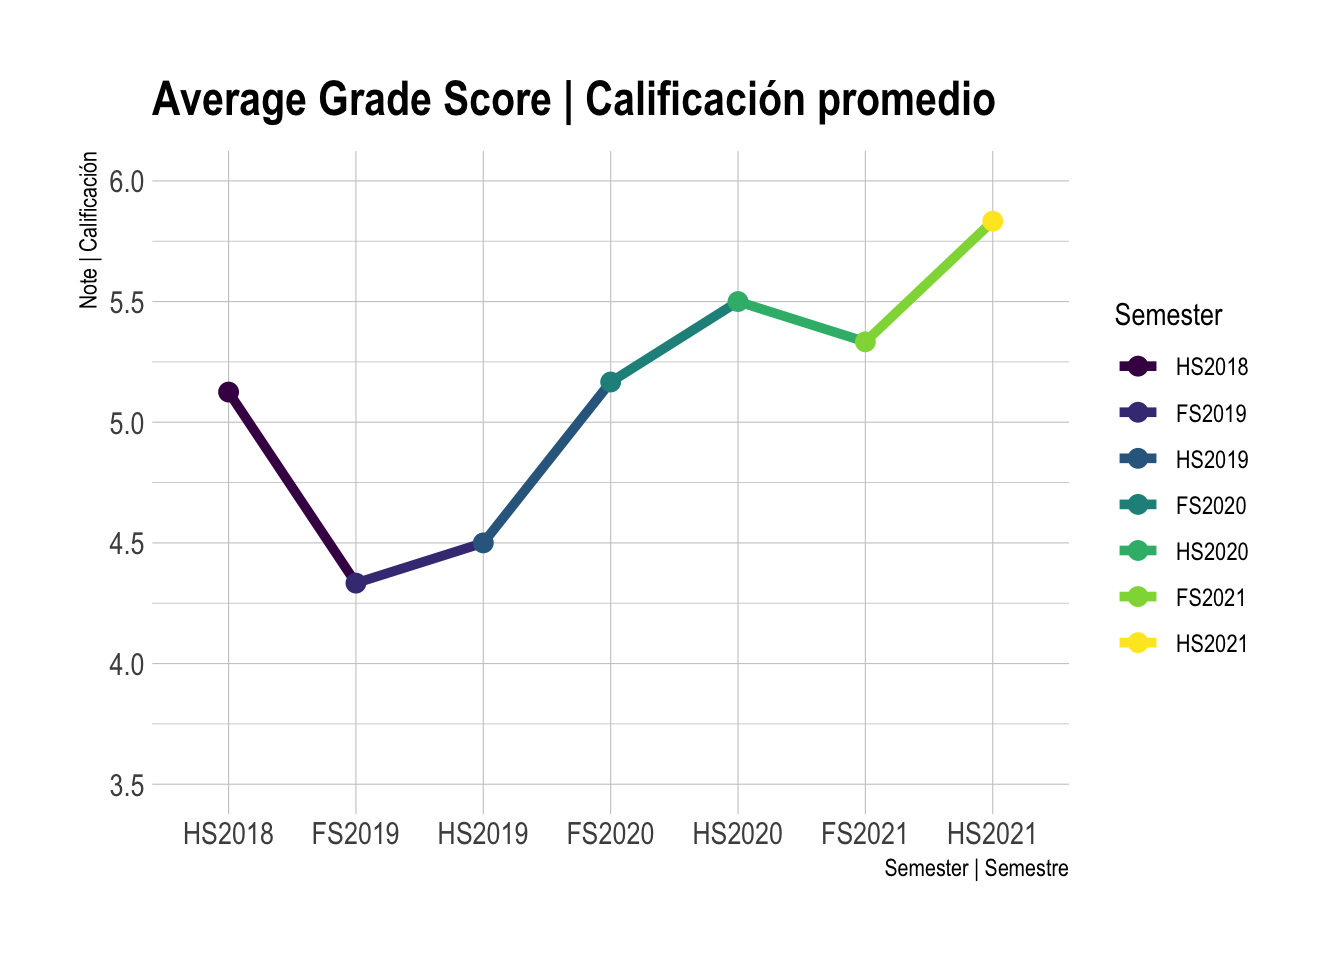
a <- ggplot(not, aes(x= kk,
y=mean,
group = 1,
colour = reorder(kk, Semester) )) +
ggtitle("Average Grade Score | Calificación promedio") +
geom_line(size=1.7) +
geom_point(size=3, shape=19, fill="white") +
xlab("Semester | Semestre") +
ylab("Note | Calificación") +
theme_ipsum() +
scale_color_viridis(discrete = T, labels = lb) +
guides(col = guide_legend(title = "Semester")) +
scale_x_discrete(labels= lb) +
ylim(3.5, 6)
a
###################
not2 <- note %>%
group_by(Semester, kk) %>%
summarise(sum = sum(ECTS), n = n())
not2 <- not2 %>%
arrange(kk)
names(not2)[3] = "ECTS"
pal <- viridis_pal()(7)
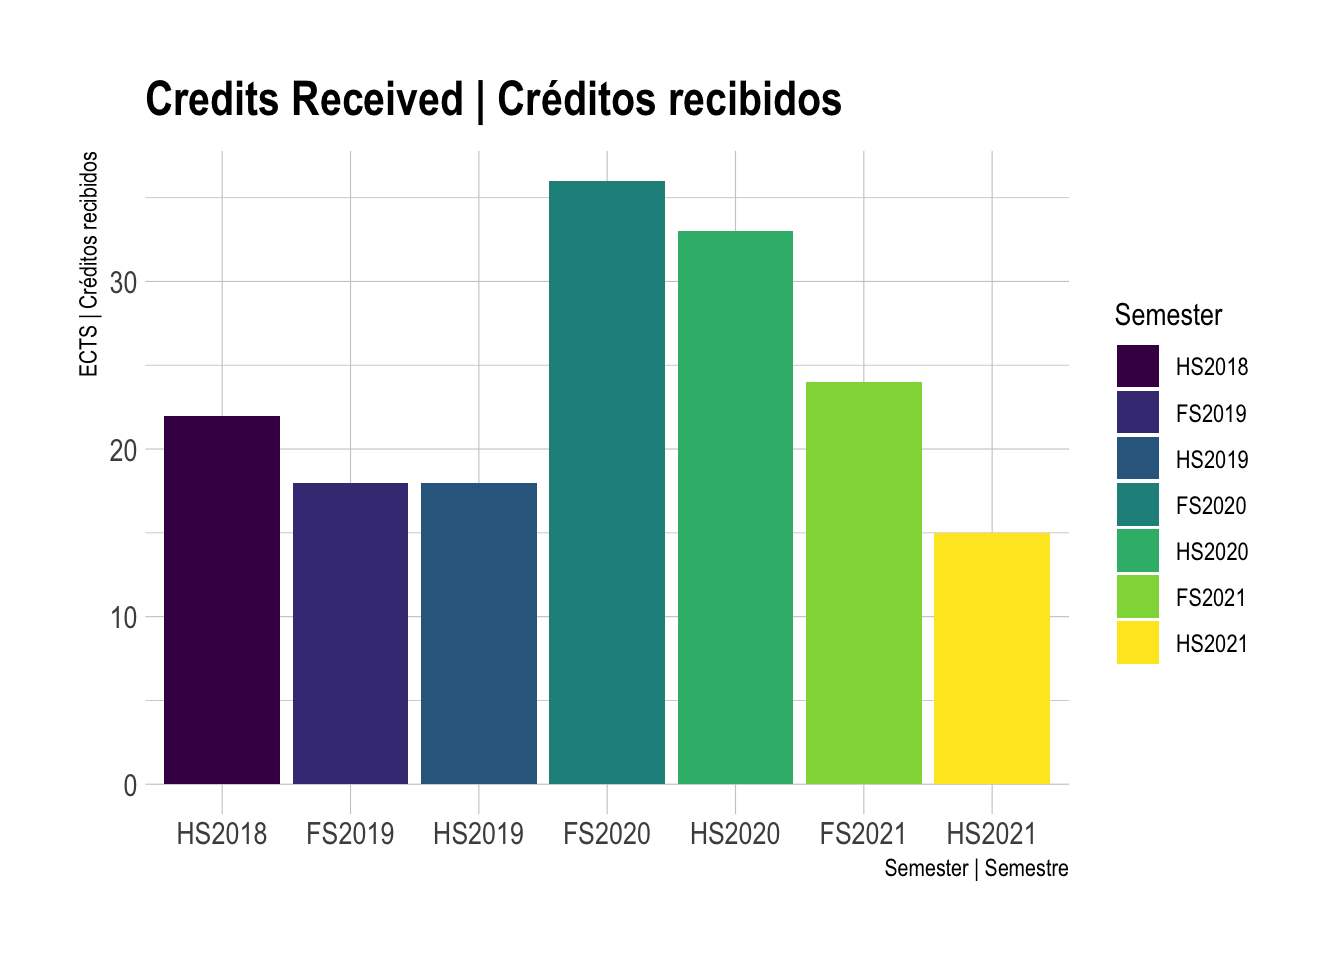
b <- ggplot(not2) +
geom_col(aes(kk,
ECTS,
fill = kk,
width = .9),
stat = 'identity') +
scale_fill_viridis_d(labels = lb,
legend_title <- "Semester") +
scale_x_discrete(labels = lb) +
theme_ipsum() +
guides(col = guide_legend(title = "ECTS")) +
labs(title = 'Credits Received | Créditos recibidos',
x = 'Semester | Semestre',
y = "ECTS | Créditos recibidos")
b
### C
note <- read_excel("note.xlsx",5)
note$month <- as.Date(note$month)

names(note)
[1] "semester" "month" "hours"
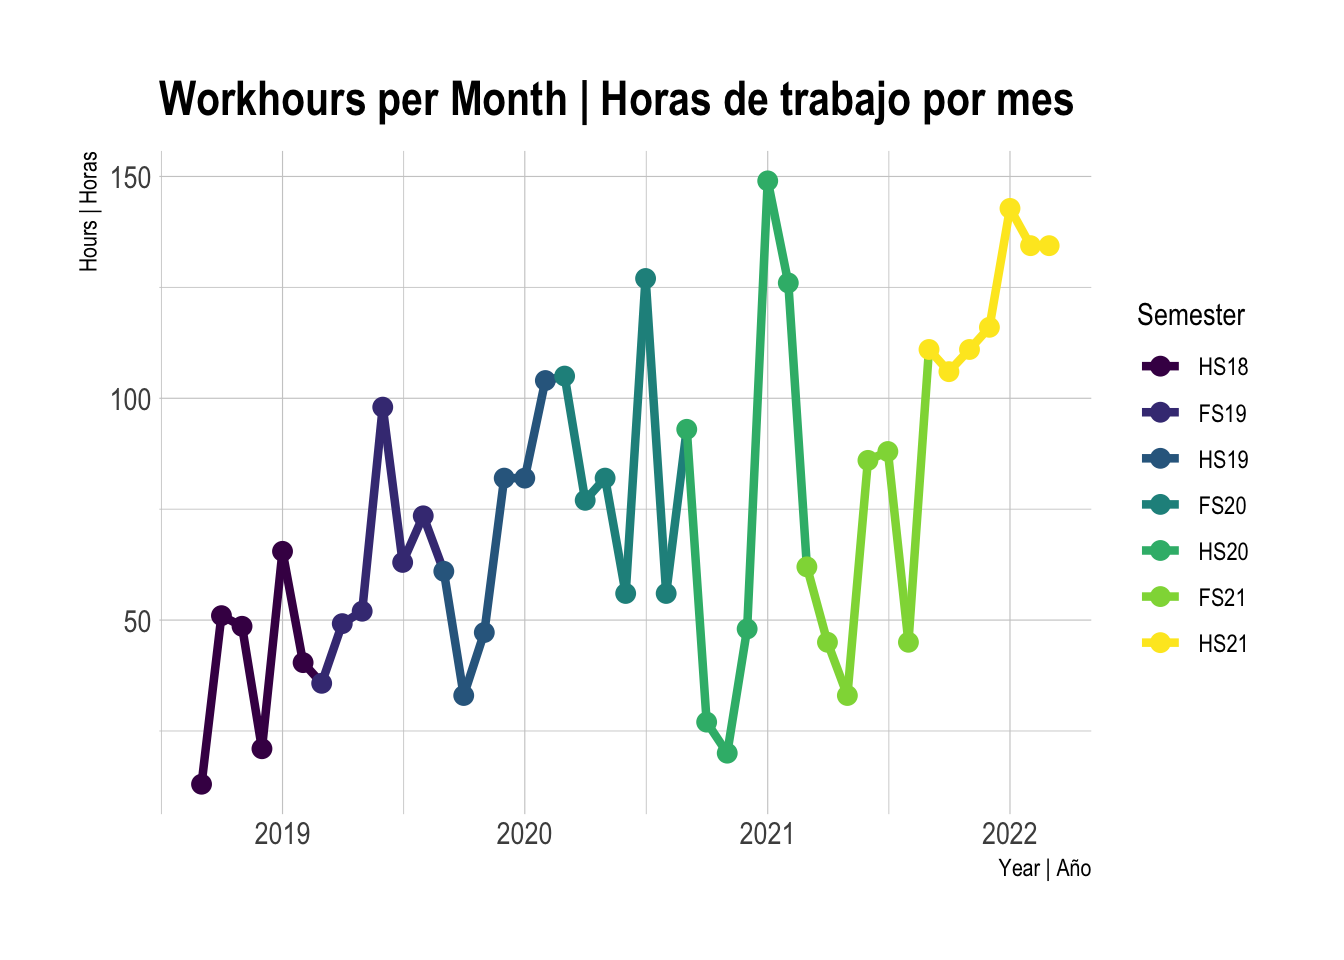
c <- ggplot(note, aes(x= month,
                     y=hours,
                     group = 1,
                     colour = reorder(semester,month) )) +
  ggtitle("Workhours per Month | Horas de trabajo por mes") +
  geom_line(size=1.5)  +
  geom_point(size=3, shape=19, fill="white") +
  xlab("Year | Año") +
  ylab("Hours | Horas") +
  theme_ipsum() +
  guides(col = guide_legend(title = "Semester")) +
  scale_color_viridis(discrete = TRUE)

c

Qualification of a university student in their last 7 semesters. 🇨🇭 🇨🇭
Working with the libraries: “ggplot2”, “dplyr”, “hrbrthemes”, “viridis”, “readxl” and “patchwork”.
- In Switzerland the maximum rating is 6 and the minimum 1.
- Customised details in the colour palette and caption.