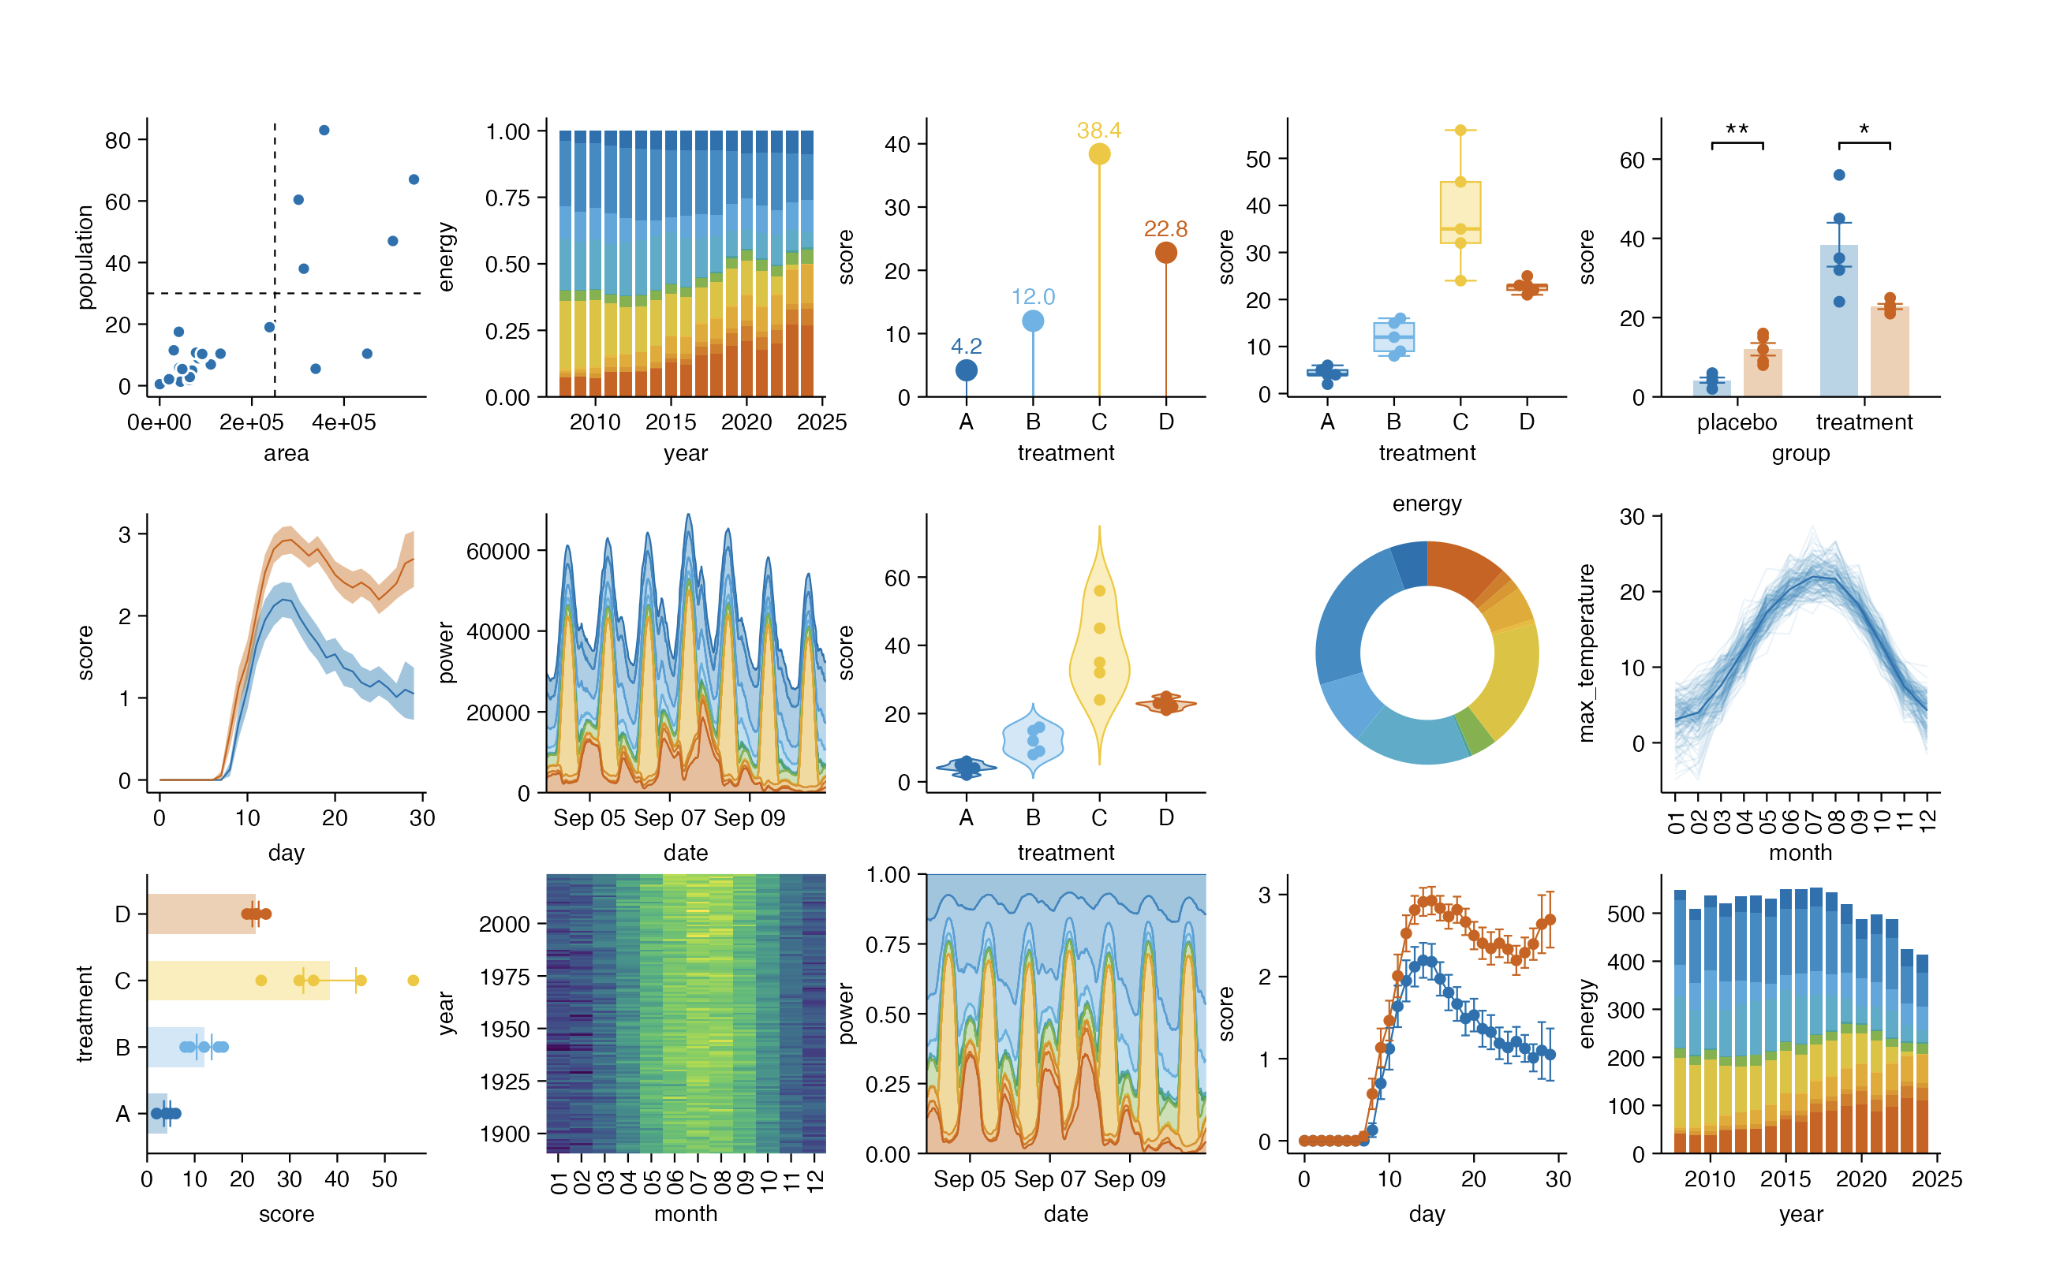
library(data.table)
library(tidyplots)TIDYPLOTS
study |>
  tidyplot(x = treatment, y = score, color = treatment) |>
  add_mean_bar(alpha = 0.4) |>
  add_sem_errorbar() |>
add_data_points_beeswarm() 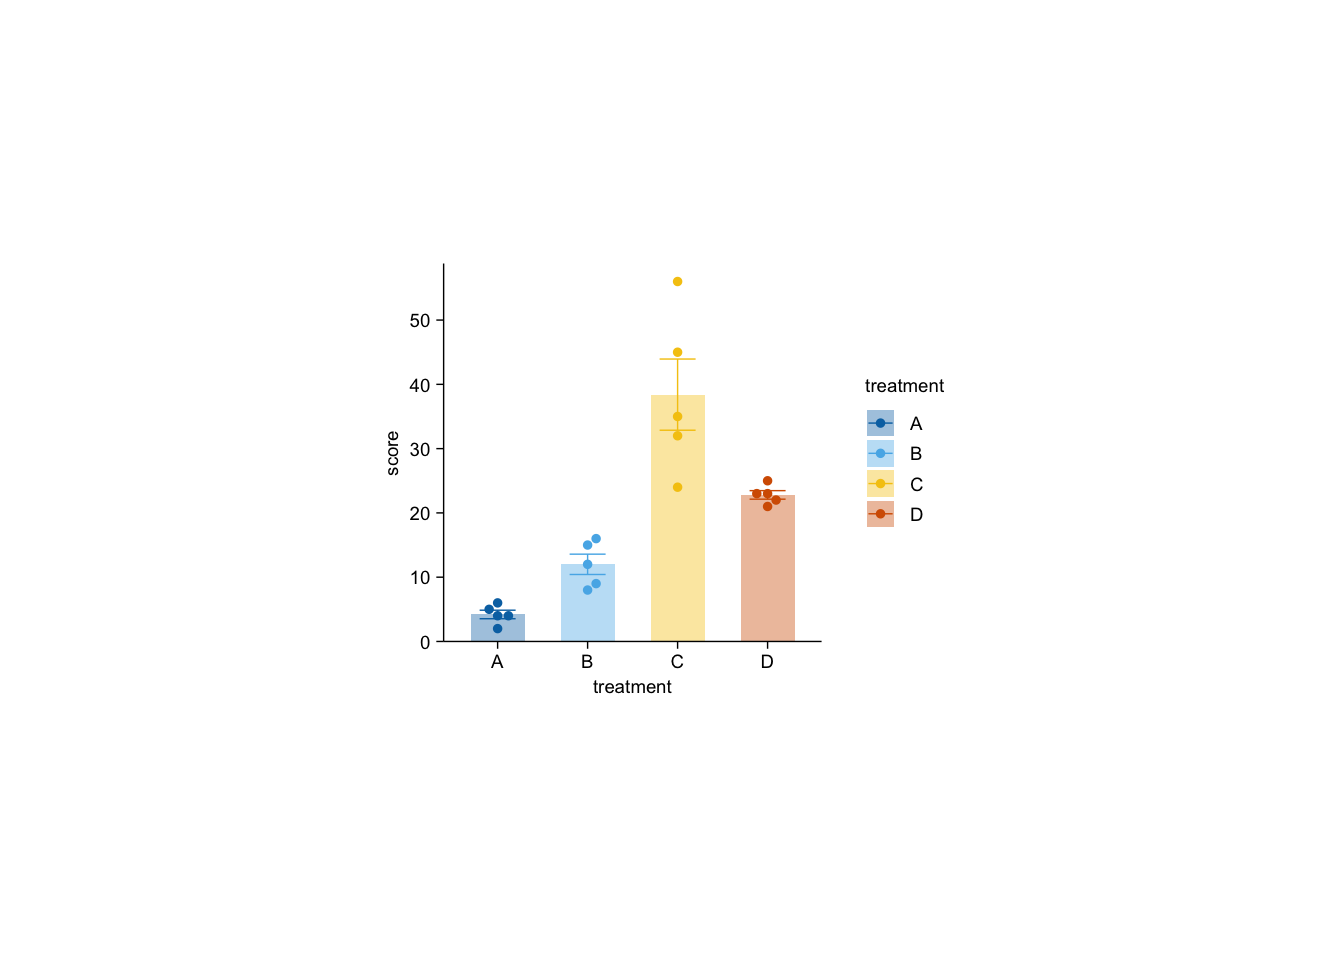
energy |>
  tidyplot(x = year, y = energy, color = energy_source) |>
  add_barstack_absolute() |>
  adjust_legend_title("FUENTES DE ENERGÍA") |>
  view_plot(title = "FUENTES DE ENERGÍA GLOBALES")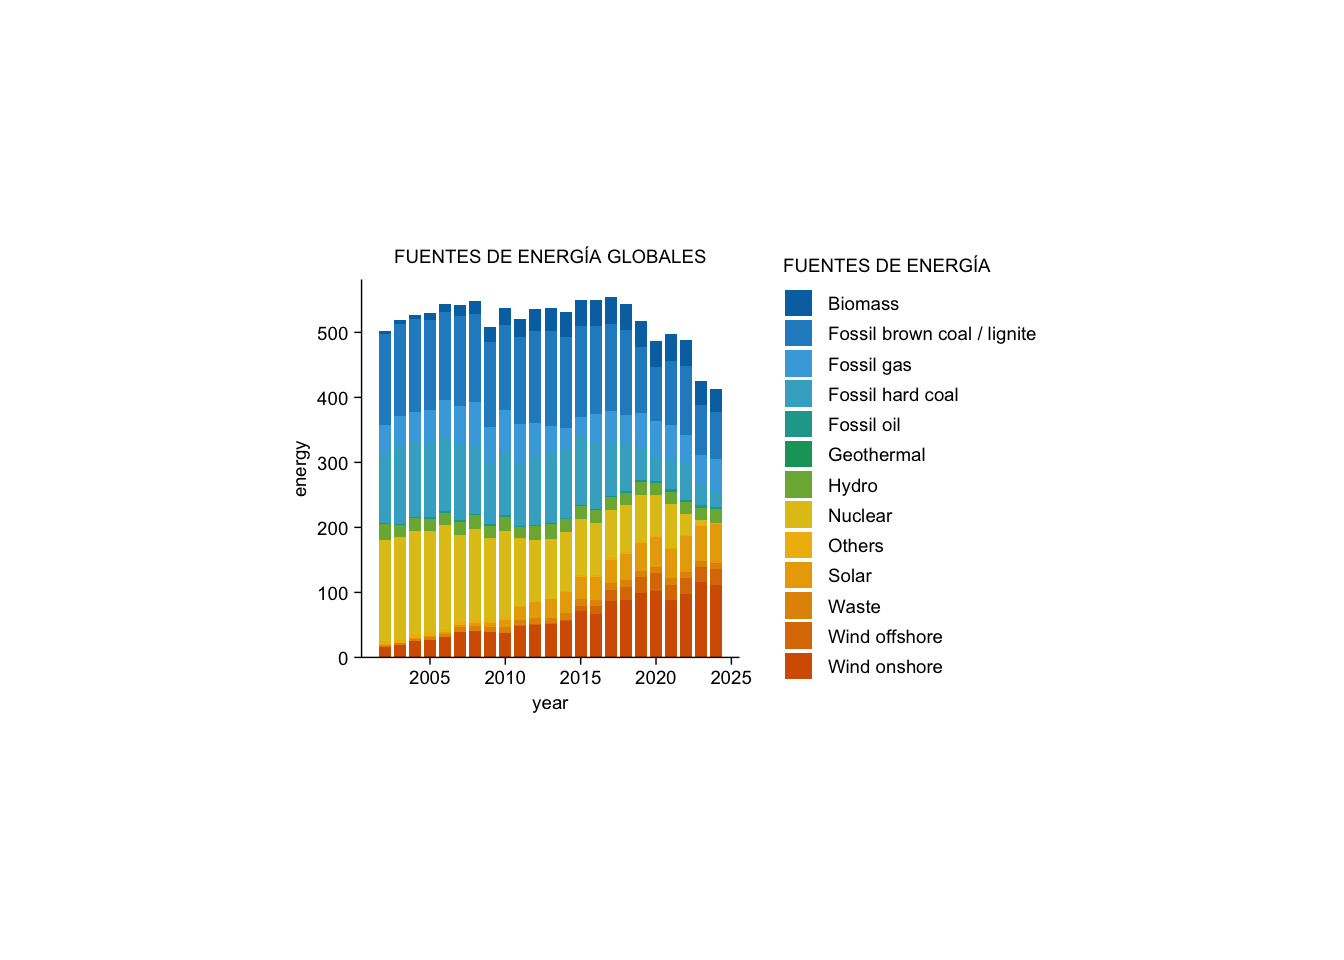
energy_week |>
  tidyplot(x = date, y = power, color = energy_source) |>
  add_areastack_relative() |>
  adjust_y_axis_title("PODER DE IMPACTO (%)") |>
  adjust_legend_title("FUENTES DE ENERGÍA") |>
  view_plot(title = "FUENTES DE ENERGÍA GLOBALES - Septiembre 2023")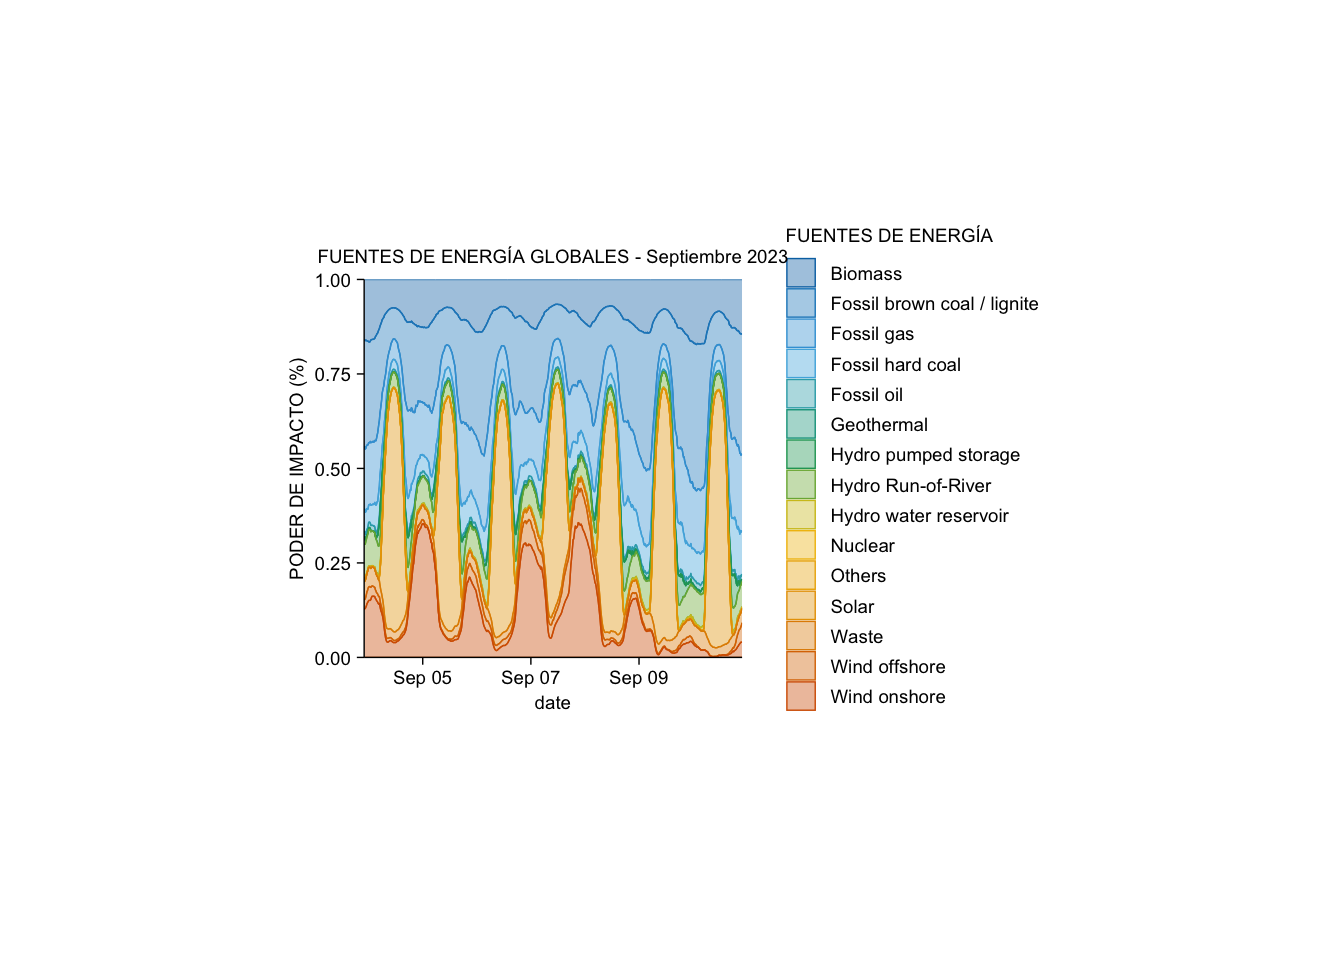
```