{
library("tidyverse")
library("showtext")
library("ggtext")
library("waffle")
library("MetBrewer")
}
storms_df <- storms|>
filter(year >= 2008,
status %in% c("hurricane", "tropical depression",
"tropical storm","tropical wave"))|>
count(year, status)
storms_df$status <- gsub('hurricane','\nHuracán\n',storms_df$status)
storms_df$status <- gsub('tropical depression','\nDepresión tropical\n',storms_df$status)
storms_df$status <- gsub('tropical storm','\nTormenta tropical\n',storms_df$status)
storms_df$status <- gsub('tropical wave','\nOnda tropical\n',storms_df$status)
font_add_google("Outfit", "title_font")
font_add_google("Cabin", "body_font")
showtext_auto()
title_font <- "title_font"
body_font <- "body_font"
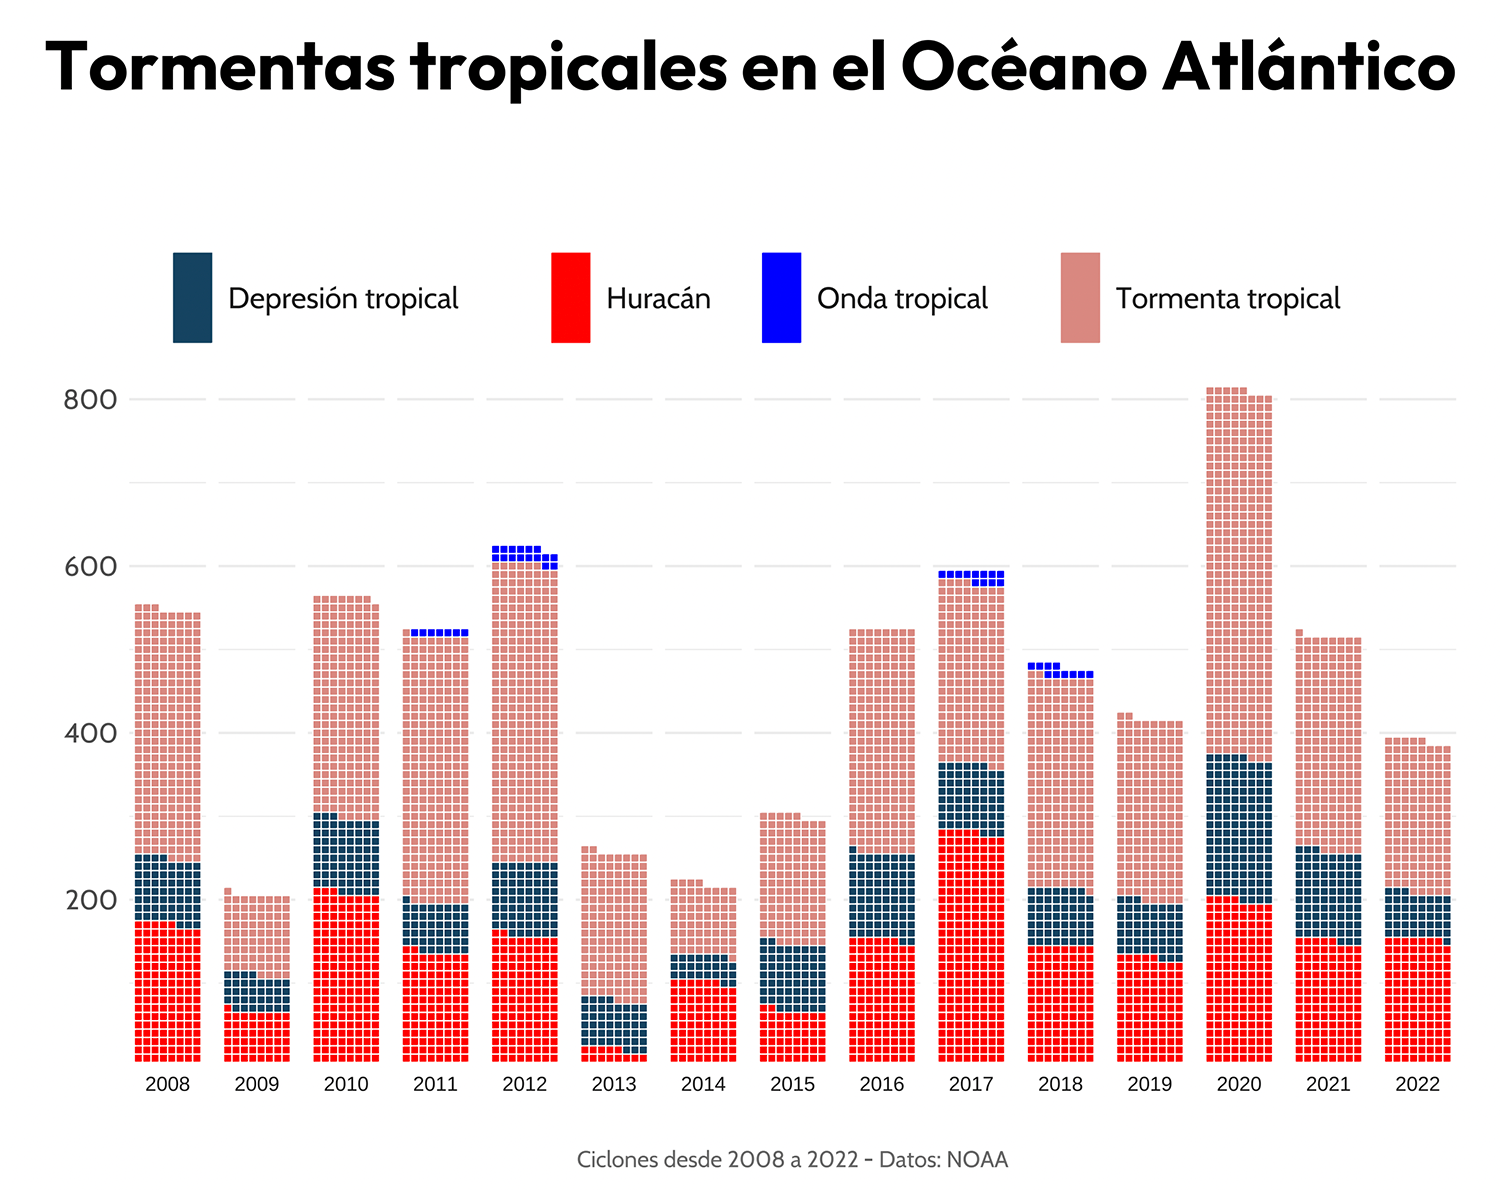
title_text <- "Tormentas tropicales en el Océano Atlántico"
subtitle_text <- ""
caption_text <- "Ciclones desde 2008 a 2022 - Datos: NOAA"
plot <- ggplot(storms_df, aes(fill = status, values = n)) +
geom_waffle(color = "white", size = .25, n_rows = 20, flip = TRUE, radius = unit(.5, "pt")) +
facet_wrap(~year, nrow = 1, strip.position = "bottom") +
scale_x_discrete() +
scale_y_continuous(labels = function(x) x * 10, # make this multiplyer the same as n_rows
expand = c(0,0))+
#MetBrewer::scale_fill_met_d("Hokusai2", direction=1) +
scale_fill_manual(values=c("#154360","red","blue","#D98880")) +
coord_equal()+
labs(title = title_text,
subtitle = subtitle_text,
caption = caption_text)+
theme_minimal()+
theme(
axis.title = element_blank(),
axis.text.x = element_text(family = body_font, size=12),
axis.text.y = element_text(family = body_font, size=12),
# Legend
legend.position = "top",
legend.title = element_blank(),
legend.spacing = unit(0.5, 'cm'),
legend.key.height= unit(0.5, 'cm'),
legend.key.width= unit(0.7, 'cm'),
legend.text = element_text(family = body_font,
size=13,
face = 'plain',
color = "grey10"),
# TITLE
plot.title.position = "plot",
plot.title = element_textbox(margin = margin(20, 0, 10, 0),
size = 30,
family = title_font,
face = "bold",
width = unit(55, "lines")),
# SUB-TITLE
plot.subtitle = element_text(margin = margin(10, 0, 20, 0),
size = 16,
family = body_font,
color = "grey15"),
# CAPTION
plot.caption = element_text(family=body_font,
face="plain",
size=10,
color="grey40",
hjust=.5,
margin=margin(20,0,0,0)),
plot.background = element_rect(color="white", fill="white"),
plot.margin = margin(20, 40, 20, 40)
)
#plot